Welcome to coolpup.py’s documentation!
Project homepage with code and issues is on GitHub.
Please feel free to report any problems or contribute.
coolpup.py
![]()
![]()
![]()
![]()
![]()
.cool file pile-ups with python.
A versatile tool to perform pile-up analysis on Hi-C data in .cool format (https://github.com/mirnylab/cooler). And who doesn’t like cool pupppies?
Introduction
What are pileups?
Pileups is the generic term we use to describe any procedure that averages multiple 2D regions (snippets) of a 2D matrix, e.g. Hi-C data. In some contexts they are also known as APA (aggregate peak analysis, from Rao et al., 2014), or aggregate region/TAD analysis (in GENOVA, van der Weide et al., 2021), and other names. The most typical use case is to quantify average strength of called dots (loops) in Hi-C data, or strength of TAD boundaries. However the approach can do much more than that. This is the idea of how pileups work to check whether certain regions tend to interact with each other:
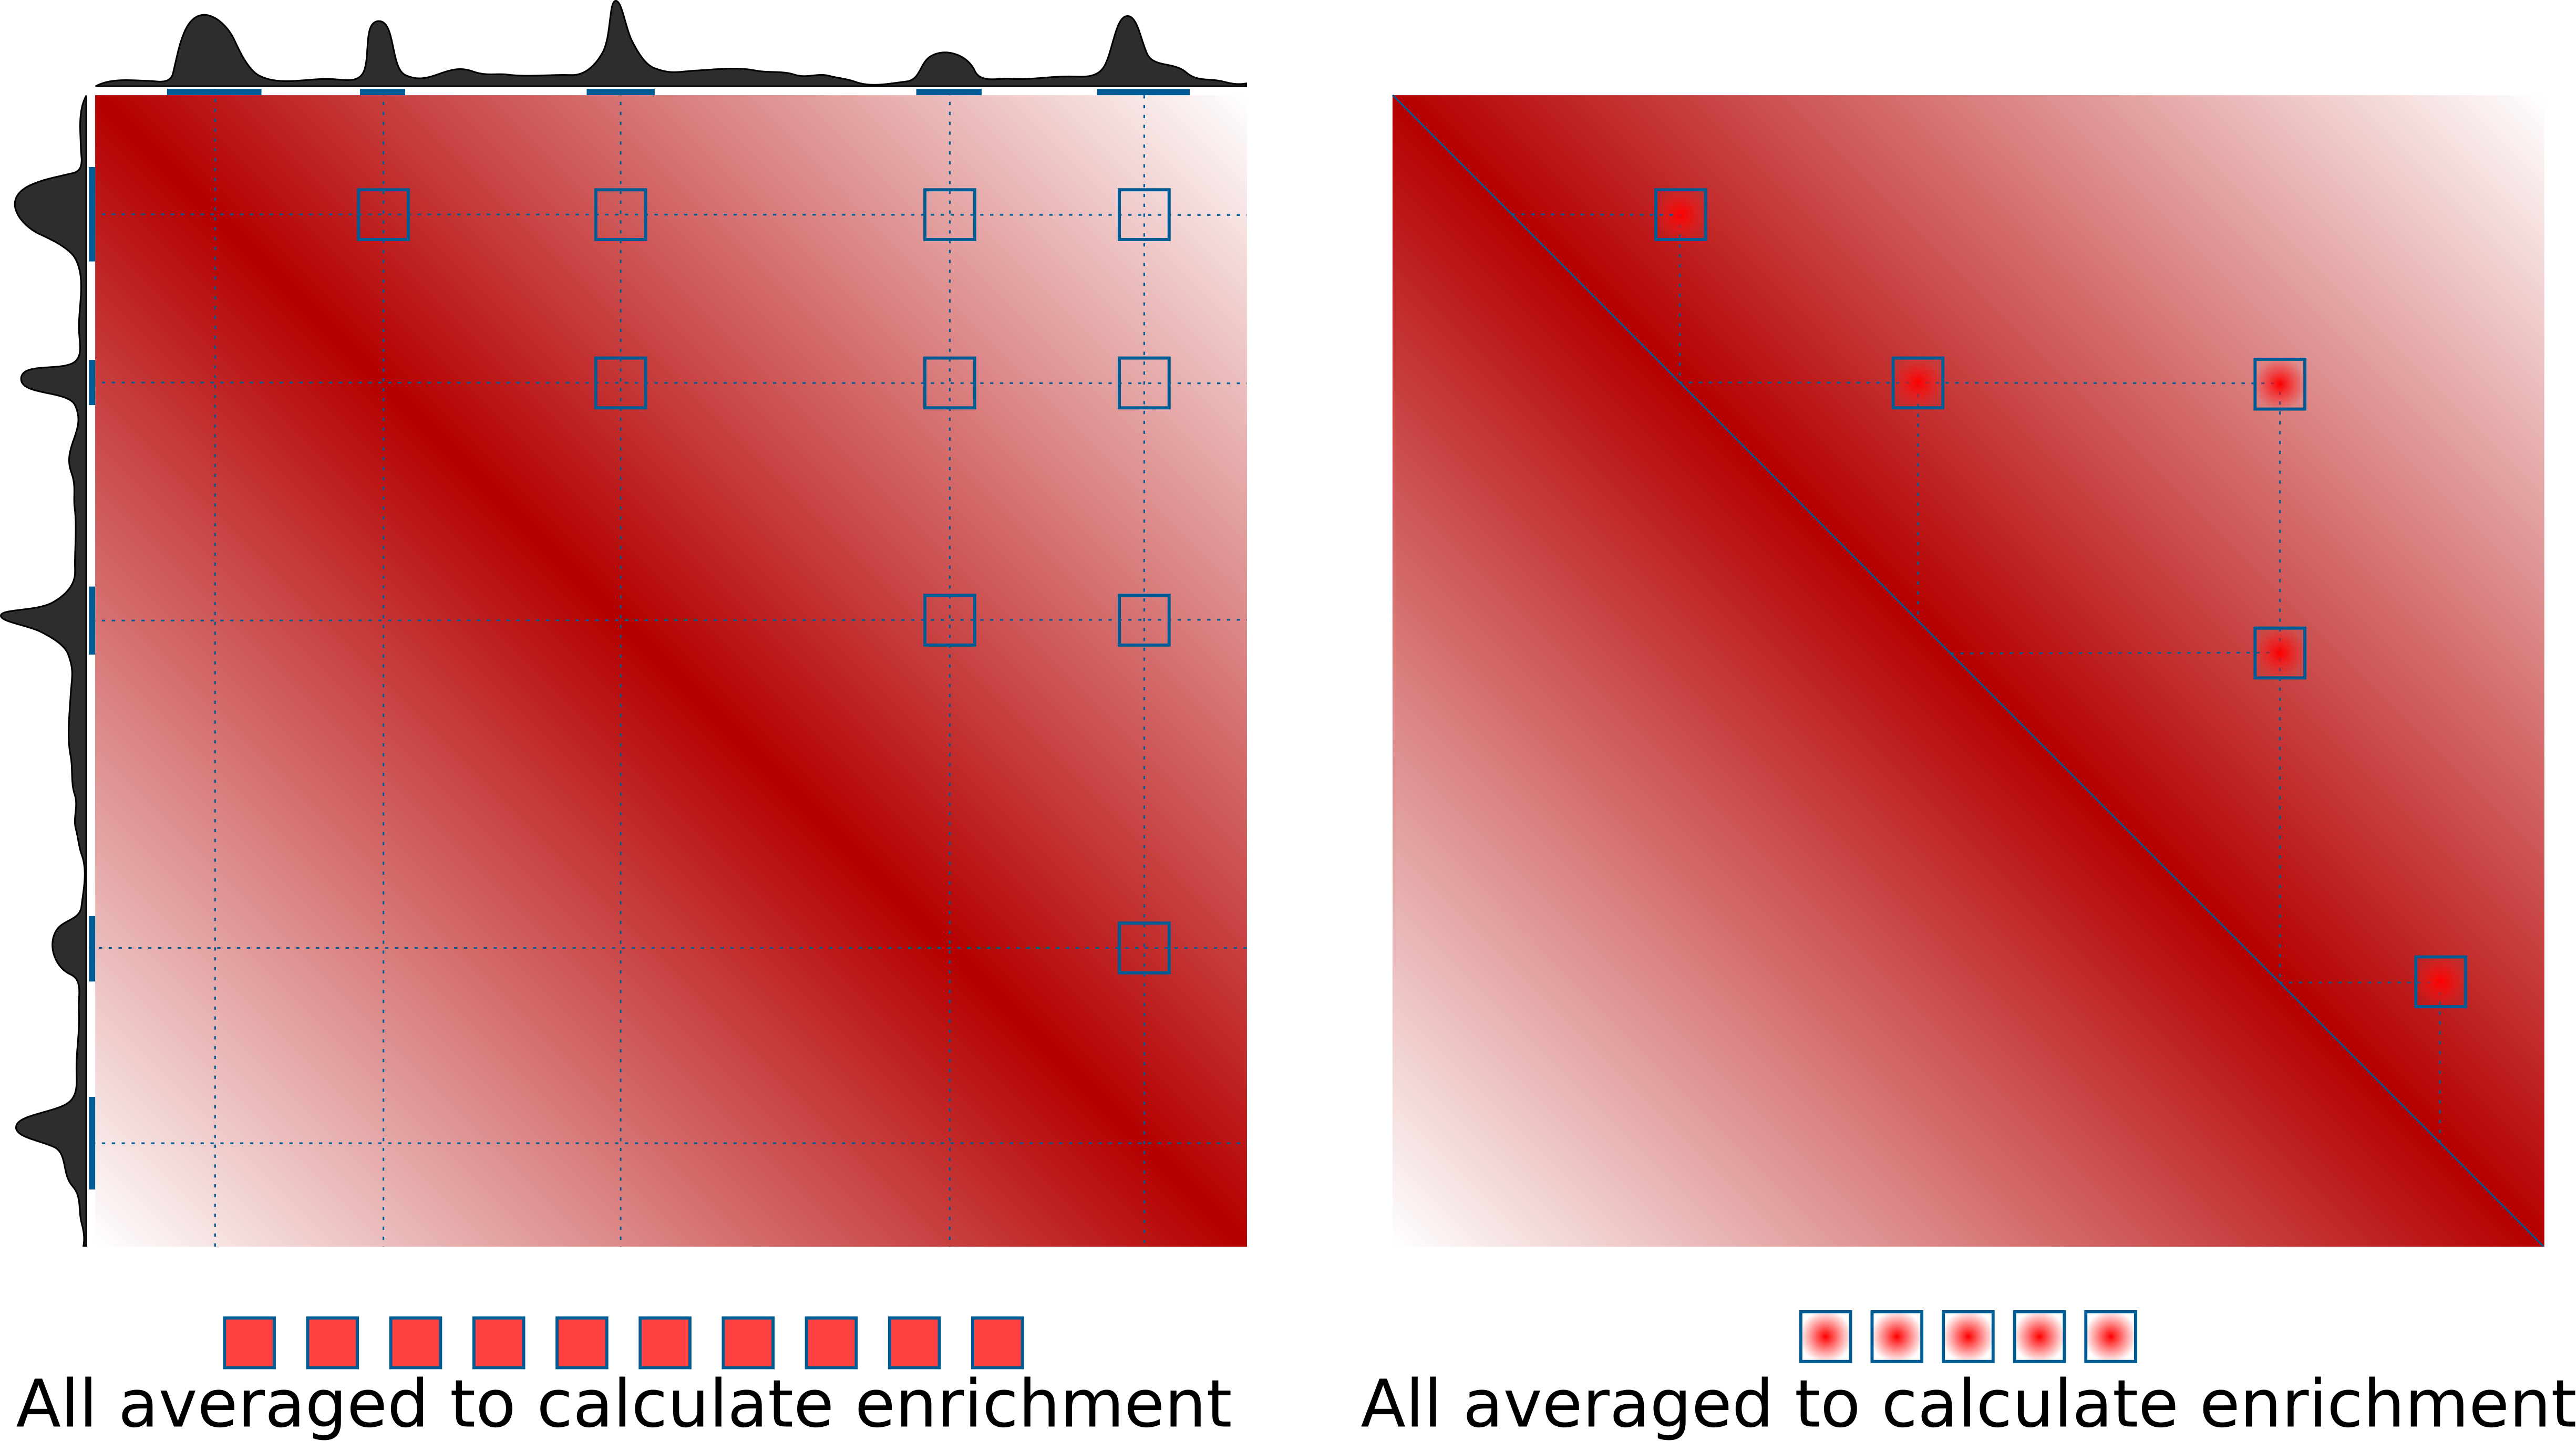
On the right is the more typical use case for quantification of loop strength. On the left is a different approach, designed to check whether specific regions in the genome (e.g. binding sites of a certain factor) tend to interact with each other.
What is very important for this quantification, is the normalization to expected values. This can be done in two ways: either using a chromosome- (or arm-) wide by-distance expected interactions, using a file with average values of interactions at different distances (e.g. output of cooltools expected-cis), or directly from Hi-C data by dividing the pileups over randomly shifted control regions. If neither expected normalization approach is used (just set --nshifts 0), this becomes essentially identical to the APA approach (Rao et al., 2014), which can be used for averaging strongly interacting regions, e.g. annotated loops. For weaker interactors, decay of contact probability with distance can hide any focal enrichment that could be observed otherwise. However, most importantly, when comparing different sets of regions at even slightly different distances, or comparing different datasets, the decay of contact probability with distance will very strongly affect the resulting values, hence normalizing to it is essential in many cases, and generally recommended.
coolpup.py vs cooltools pileup
cooltools is the main package with Hi-C analysis maintained by open2C. It also has a tool to perform pileups. Why does coolpup.py exist then?
The way cooltools pileup works, is it accumulates all snippets for the pileup into one 3D array (stack). Which gives a lot of flexibility in case one wants to subset the snippets based on some features later, or do some other non-standard computations based on the stack. But this is only advantageous when one performs analysis using the Python API, and moreover limits the application of cooltools pileup so it can’t be applied to a truly large number of snippets due to memory requirements. That’s where coolpup.py comes in: internally it never stores more than one snippet in memory, hence there is no limit to how many snippets can be processed. coolpup.py is particularly well suited performance-wise for analysing huge numbers of potential interactions, since it loads whole chromosomes into memory one by one (or in parallel to speed it up) to extract small submatrices quickly. Having to read everything into memory makes it relatively slow for small numbers of loops, but performance doesn’t decrease until you reach a huge number of interactions. Additionally, cooltools pileup doesn’t support inter-chromosomal (trans) pileups, however it is possible in coolpup.py.
While there is no way to subset the snippets after the pileup is generated (since they are not stored), coolpup.py allows one to perform various subsetting during the pileup procedure. Builtin options in the CLI are subsetting by distance, by strand, by strand and distance at the same time, and by window/region - in case of a provided BED file, one pileup is generated for each row against all others in the same chromosome; in case of trans-pileups, pileups for each chromosome pair can be generated. Importantly, in Python API any arbitrary grouping of snippets is possible.
.cool format
.cool is a modern and flexible format to store Hi-C data.
It uses HDF5 to store a sparse representation of the Hi-C data, which allows low memory requirements when dealing with high resolution datasets. Another popular format to store Hi-C data, .hic, can be converted into .cool files using hic2cool (https://github.com/4dn-dcic/hic2cool).
See for details:
Abdennur, N., and Mirny, L. (2019). Cooler: scalable storage for Hi-C data and other genomically-labeled arrays. Bioinformatics. 10.1093/bioinformatics/btz540
Getting started
Installation
All requirements apart are available from PyPI or conda.
Before installing everything you need to obtain Cython using either pip or conda. Then for coolpuppy (and other dependencies) simply do:
pip install coolpuppy
or
pip install https://github.com/open2c/coolpuppy/archive/master.zip
to get the latest version from GitHub. This will make coolpup.py callable in your terminal, and importable in python as coolpuppy.
Usage
The basic usage syntax is as follows:
coolpup.py [OPTIONS] coolfile.cool regionfile.bed
A guide walkthrough to pile-up analysis is available here (WIP): Walkthrough
Docs for the command line interface are available here: CLI docs
Some examples to get you started with CLI interface are available here and for the python API examples see here.
Plotting results
For flexible plotting, I suggest to use matplotlib or another library. However simple plotting capabilities are included in this package. Just run plotpup.py with desired options and list all the output files of coolpup.py you’d like to plot.
Citing coolpup.py
Ilya M Flyamer, Robert S Illingworth, Wendy A Bickmore (2020). Coolpup.py: versatile pile-up analysis of Hi-C data. Bioinformatics, 36, 10, 2980–2985.
https://academic.oup.com/bioinformatics/article/36/10/2980/5719023
doi: 10.1093/bioinformatics/btaa073